Analyzing Team Passing Networks Through Possession Outcomes
Written on
Introduction to Network Analysis in Football
This project delves into the application of network science to football analysis, aiming to explore dimensions of the game that conventional statistics often overlook. Collaborating with Marc Estévez and guided by tutors Javier M. Buldú and Sergi Nadal, we undertook this endeavor as part of our Final Project for the Postgraduate in Sports Analytics offered by FC Barcelona and UPC School.
Football is a multifaceted sport characterized by numerous players interacting under dynamic and uncertain conditions, rendering traditional statistical approaches inadequate. To address this, we advocate for the use of network science—an interdisciplinary domain that examines complex systems as networks or graphs. This approach facilitates a deeper understanding of team dynamics, strategies, and performance in football, uncovering elements not easily quantifiable by standard statistics.
Network science can accommodate various levels of complexity and granularity, including aspects such as dynamics, spatial configurations, time, and the multilayer nature of the game. We will also review existing literature that employs network analysis to assess football teams' passing networks, highlighting different levels of granularity and complexity. Ultimately, we propose a new research initiative that seeks to enhance current methodologies by defining networks based on the outcomes of ball possession.
Related Work in Network Science
In recent years, network science has gained traction as a powerful tool for analyzing sports data, particularly in football. Traditional metrics, often focused on individual player performance or aggregated team statistics, fail to capture the intricate nuances of the game. By representing teams as passing networks, network science offers a fresh lens through which to examine football.
Numerous studies have successfully utilized network science to explore football passing networks across various levels of detail and abstraction. Some investigations have centered on player passing networks, where nodes represent players and edges are weighted according to the frequency of passes exchanged. These analyses have revealed correlations between network properties—such as centrality, clustering, efficiency, modularity, and assortativity—and team performance indicators like ball possession and goals scored or conceded.
Other research has focused on pitch passing networks, where nodes represent specific field regions connected through player passes. These studies investigate how passing patterns differ among teams, positional play, and match situations, influencing outcomes such as scoring chances and defensive effectiveness.
A third category of passing networks involves pitch-player passing networks, which combine player identity with their position at the time of the pass. These analyses have examined player movement, distribution on the field, and how positioning impacts passing behavior and network roles. Additionally, some studies have integrated temporal and multilayer dimensions to capture the dynamic nature of passing networks in football.
Buldú et al. (2018) introduced a framework for analyzing football passing networks across four dimensions: dynamics, spatial layout, temporal factors, and layers. This framework was applied to a season of the Spanish national league, comparing different teams through their network characteristics.
One standout team in these analyses was F.C. Barcelona under coach Pep Guardiola, recognized as one of football's greatest teams. Buldú et al. (2019) further investigated this team, utilizing data from 38 matches during the 2008–2009 La Liga season, where Barcelona achieved an impressive 99 points out of a possible 114. The study identified key characteristics of their playing style, including high connectivity and clustering, diverse centrality, and short passing distances coupled with low modularity.
Network science applied to football yields multiple insights, from player connectivity and cooperation to team structure, style of play, and overall cohesion. These metrics are vital for understanding player interactions and their impact on team performance.
Problem Statement
The research project's problem statement centers on applying network science within sports analytics, specifically in football. The analysis identifies three distinct types of networks corresponding to various possession outcomes: (A) maintaining possession despite the sequence ending (e.g., following a foul or corner), (B) actions culminating in a shot, and (C) instances where the team loses possession. The primary objective is to determine whether certain players are more involved in actions leading to shots compared to those associated with losing possession.
To achieve this goal, we analyzed event datasets from an entire season to construct and evaluate team passing networks. By applying various network metrics, we aimed to understand how teams organize their passing and identify pivotal players. Additionally, we examined how the structure of passing networks fluctuates based on the final outcome of the action and compared it to a comprehensive network encompassing all passes made during a match.
Data Description
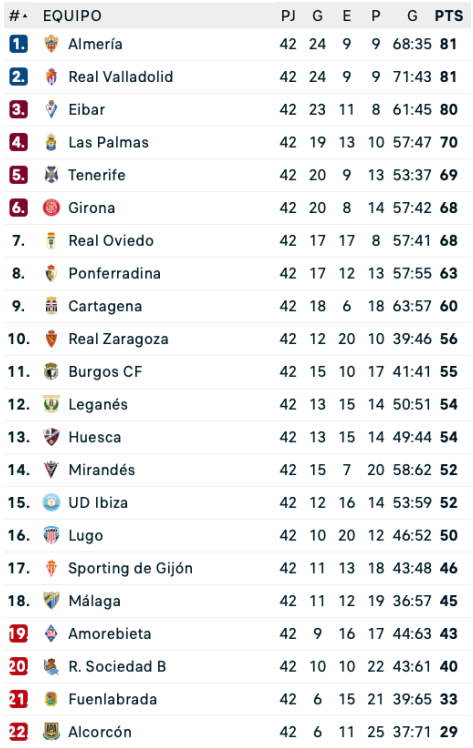
The data utilized for this study comprises four distinct files for each of the 462 matches played during the 2021/2022 La Liga Smartbank season, sourced from Opta.
The dataset includes four groups of files: (1) team identifiers and names, (2) player details, (3) pass data, and (4) shot information. The player information files provide identifiers, names, teams, positions, and minutes played. The passing data includes match identifiers, team identifiers, pass outcomes, and positional details. The shot data contains match and team identifiers, expected goal probabilities, and relevant player and goalkeeper information. On average, there were over 897 passes and 24 shots per match during the analyzed season.
Data Management Strategy
This section focuses on data management within the research project. Our goal is to analyze the passing dynamics among players and identify key contributors based on pass sequences and outcomes. We collected all passes made in each match, linking them to the team in possession and the players involved.
Subsequently, we replicated this process for actions leading to shots and instances of possession loss, averaging nearly 40 and 196 occurrences in each respective passing network. In summary, from each match and team, we derived three distinct networks that encapsulated pass interactions, calculating the number of passes made and received between player pairs. From these networks, we computed centrality values for players, including the total number of passes made and received, their centrality scores, and their positional roles.
Methodology and Basic Network Concepts
A network is defined as a collection of vertices and edges, where vertices represent players and edges connect two players if a pass occurred during the match. We employed directed networks, with edges consisting of ordered pairs to reflect the passer and receiver. We assigned weights to these edges to denote the number of passes exchanged between players, visualizing the networks with adjacency matrices representing edge weights.
Our analysis aimed to identify players who significantly contribute to offensive plays and understand how teams distribute passes among players. This methodology offers a nuanced perspective on team performance while in possession, yielding insights for enhancing strategies and player selection.
To explore further insights into passing networks, check out this article where I discuss a paper featuring four distinct types of networks utilizing tracking data:
Eigenvector Centrality Analysis
This section outlines the use of eigenvector centrality to derive essential information regarding player significance within passing networks. Eigenvector centrality for each player is calculated using the adjacency matrix, allowing us to gauge the importance of individual players based on their connections. The analysis reveals the relevance of players in passing networks, distinguishing those who are central from those less involved in play creation.
Using the NetworkX library in Python, we computed eigenvector centralities, analyzing their distribution across all teams and identifying key players for each network type. We further evaluated the differences in centrality between passing networks leading to shots and those resulting in lost possession, allowing us to pinpoint players who excel in positive situations versus those involved in negative outcomes.
The results provide valuable insights into individual player contributions within passing networks and their implications for overall team performance.
Results and Insights
In our research, we analyzed passing networks from the La Liga Smartbank 2021/2022 season using the eigenvector centrality metric. This analysis involved calculating centrality for each player across various passing networks, revealing the most influential players within each context (total passes, sequences leading to shots, and instances of lost possession). We also assessed the variability of centrality across teams, identifying disparities in player importance.
The analysis highlights key performers in different situations, shedding light on players who significantly impact play creation and those who contribute to a more homogeneous or heterogeneous team network.
Players’ Performance Metrics
This section evaluates player performance in passing networks, particularly focusing on eigenvector centralities. By comparing centralities across total passes, lost passes, and passes leading to shots, we identified patterns in player involvement.
We found that the distributions for total and lost passes were similar, whereas passes leading to shots exhibited a different pattern with a mix of both low and high values. This indicates that a greater number of players are less involved in sequences that result in shots.
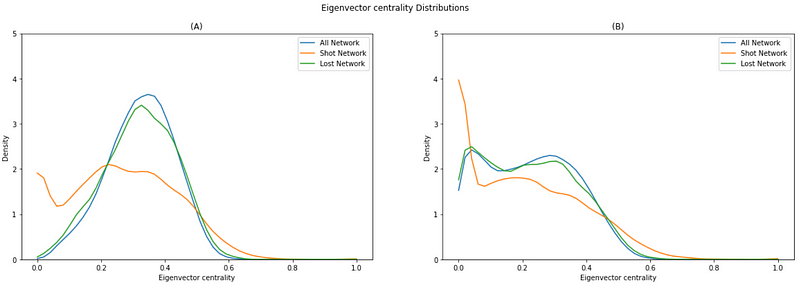
To address the challenge of retaining valuable data from players who don't play the full match, we considered players who participated for at least 360 minutes during the season. This approach yielded similar distributions but included more lower centralities that were previously excluded.
Furthermore, our examination of top-performing players across different networks revealed that the leading players in total and lost pass networks differed from those in the shot network, indicating variable roles based on the network type.
This analysis provides critical insights into player performance across various network types, facilitating a better understanding of their roles and contributions.
Comparative Analysis of Average Performances
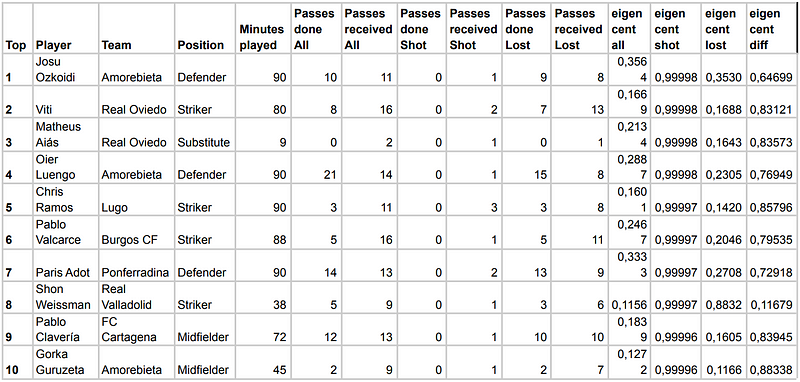
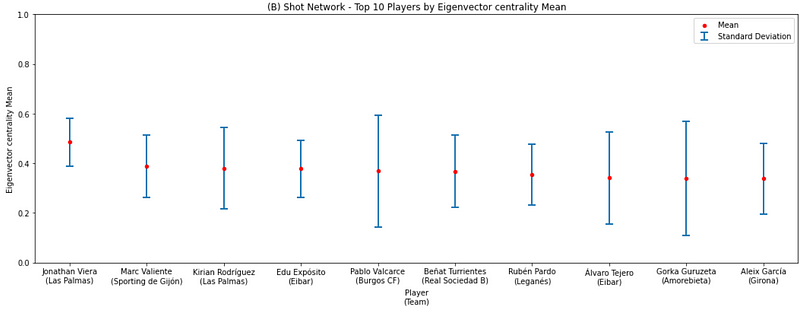
This section focuses on the average performance of players throughout the season based on their eigenvector centrality across three networks: All, Lost, and Shot. We selected the top 10 players for each network, emphasizing their average centrality and standard deviation to gauge consistency.
The results revealed that the All and Lost networks showed similar trends, while the Shot network featured a distinct pattern. The leading players in the first two networks exhibited mean centrality scores between 0.4 and 0.5, with lower standard deviations compared to the Shot network, which had greater variability.
Interestingly, defenders predominantly populated the All and Lost networks, while strikers and midfielders were more common in the Shot network.
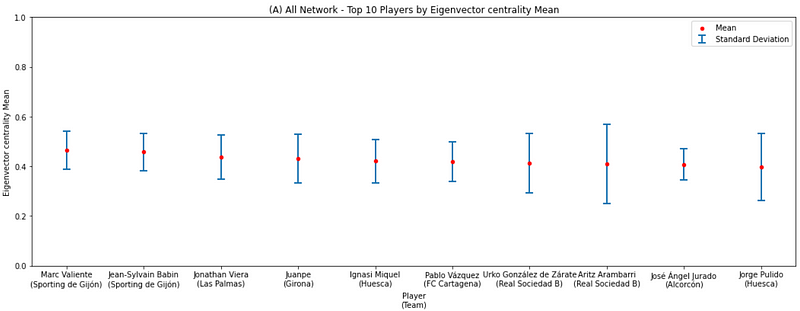
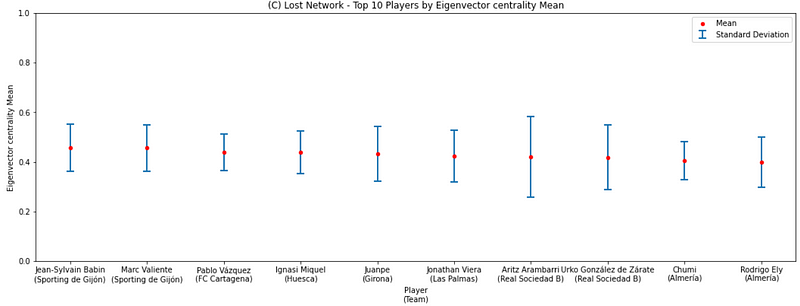
Certain teams consistently appear in top rankings, with Sporting de Gijón showcasing the top two players in both the All and Lost networks, while Real Sociedad B frequently appears in all three. This analysis sheds light on players’ performances across the season and their varying contributions to different network types.
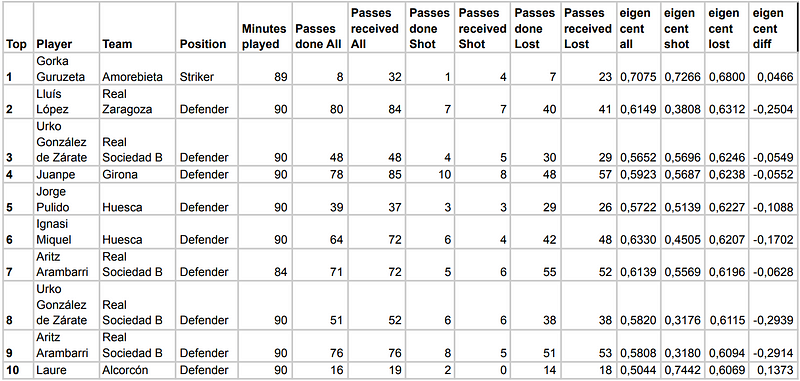
Shot versus Lost Network Analysis
In this section, we analyze player involvement in plays resulting in shots versus those where possession is lost. We sought to identify players more engaged in shot opportunities compared to those involved in lost actions.
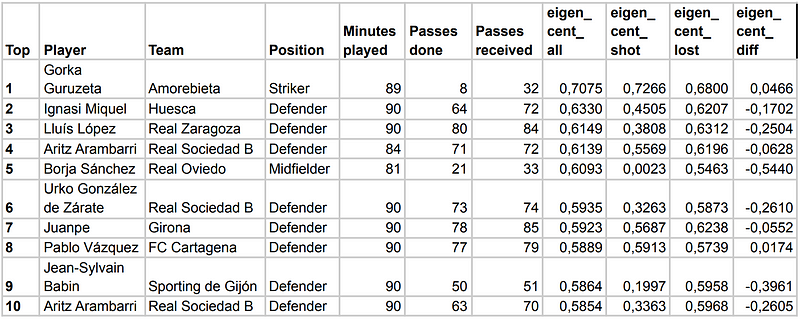
Our findings indicated that certain players significantly contribute to shot plays while others are more involved in lost actions. Ranking the top and bottom players based on the mean difference in eigenvector centrality between the Shot and Lost networks revealed that the top players were mainly strikers or those with dual roles, while the bottom players were predominantly defenders.
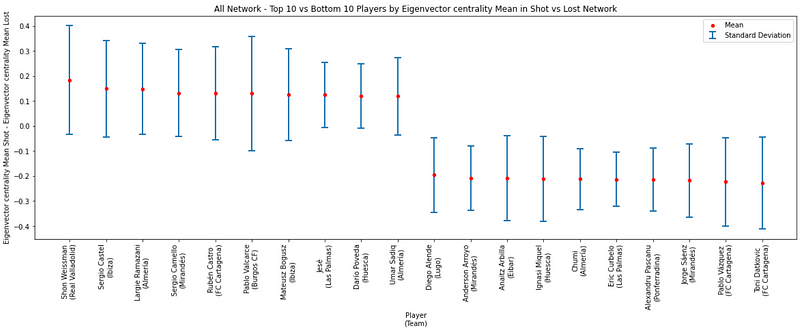
This analysis underscores the differences between the two networks, highlighting the varying roles of players based on their contributions to shot plays and possession losses.
Team Passing Network Homogeneity
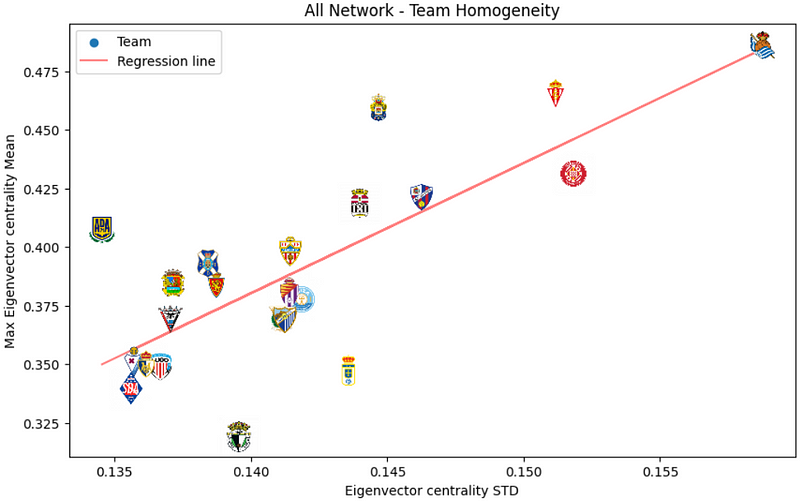
In this section, we examine the homogeneity of passing networks from a team perspective by calculating the standard deviation of eigenvector centrality values across outfield players for each team. Excluding goalkeepers allows us to focus on the variability among outfield players.
Our findings suggest that teams with prominent players in passing networks exhibit more variability in centrality values, resulting in heterogeneous networks. Conversely, teams lacking standout players tend to distribute passes more uniformly. We provide a scatterplot illustrating the relationship between maximum average centrality and standard deviation of centrality by team, indicating that teams with more prominent players generally have more heterogeneous passing networks.
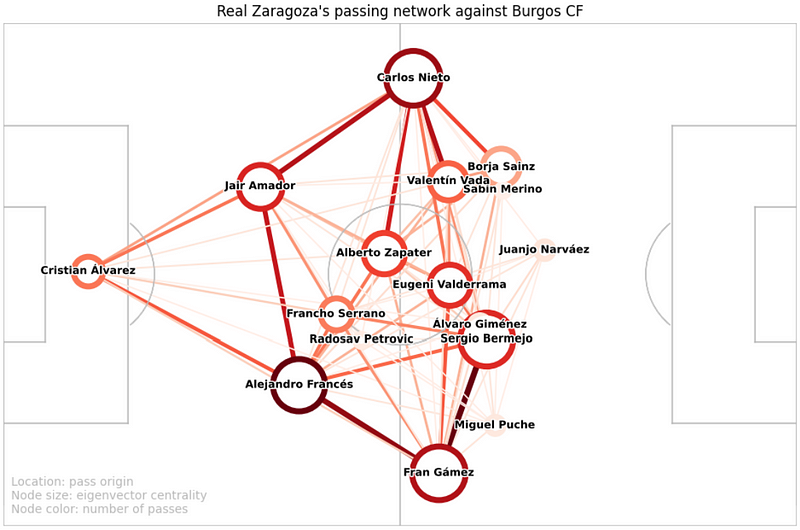
Passing Networks from Match Examples
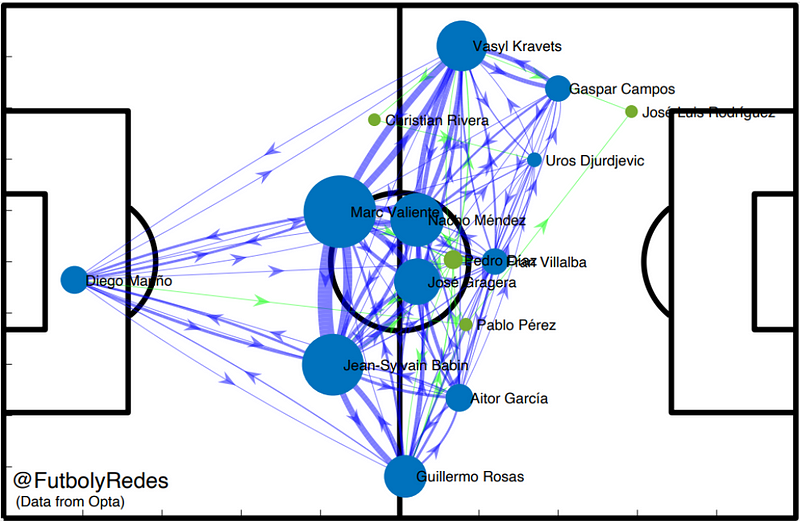
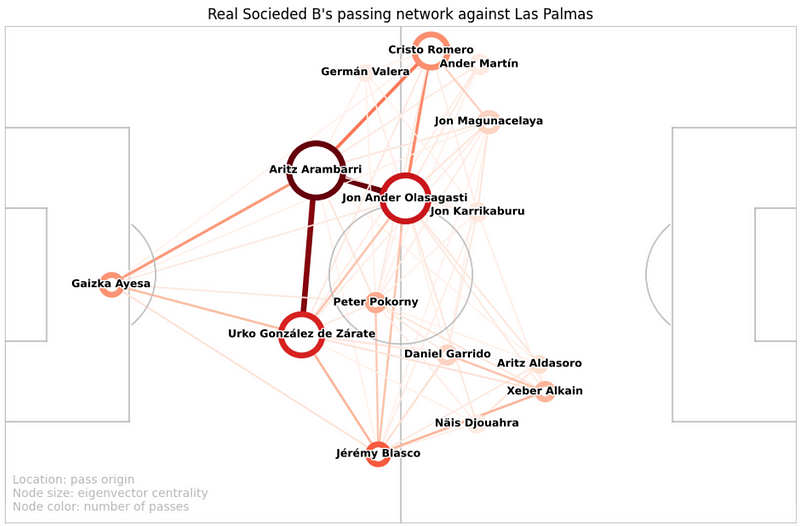
This section presents two passing networks from different matches to illustrate the variability in passing structures. The networks were generated using code from the GitHub repository for passing networks in Python.
The first network, representing a match involving Real Sociedad B, features a player with the highest eigenvector centrality. Node sizes reflect eigenvector centrality values, while colors indicate the number of passes made. The network reveals that central players are primarily defenders, with one midfielder also playing a key role.
The second network, from a match involving Real Zaragoza, displays a more even distribution of passes among players, with no standout central player. In this case, defenders again hold the highest centrality scores, although a midfielder in a more advanced role also contributes significantly.
Discussion and Future Directions
In discussing our findings, we reflect on our approach to analyzing passing networks in football matches. Initially, we concentrated on players who participated for the entire match, but this limited our analysis primarily to defenders. Consequently, we expanded our criteria to include players who participated for at least 360 minutes in a season, ensuring a more comprehensive assessment of contributions from players with less playing time.
The analysis revealed that Shot Networks typically featured fewer passes and were more polarized than the All and Lost Networks, with strikers and offensive midfielders being more prominent. Some teams exhibited an even distribution of passes, while others relied heavily on one or two key players with high eigenvector centrality scores.
A limitation of this analysis stems from the eigenvector centrality algorithm, which places greater significance on receiving players compared to passing players in directed networks. This may lead to unexpected outcomes, particularly in short possession scenarios. To mitigate this issue, we propose establishing a connection between the last receiver and passer in the opposite direction to enhance connectivity for the last node.
Moving forward, we suggest clustering teams based on the homogeneity or heterogeneity of their passing networks to identify those that depend on a single key player versus those that distribute passes more evenly. We also propose an investigation into the role of goalkeepers in influencing a team's passing dynamics.
Full Research and Resources
For further insights and comprehensive data on this research, please visit our GitHub repository at:
Learn More
- The Value of Positioning: An Innovative Approach to Measuring Player Impact in Football
- A New Approach to Tactical Pattern Detection in Team Sports
- A New Framework for Valuing Player Actions in Football Games
- How does the strategy of a football team evolve over time?
- Unleashing the Power of Positional and Event Data in Football!