Effortless Remote Debugging for Python Apps in Kubernetes
Written on
Introduction to Remote Debugging
Imagine you have several Python applications running on Kubernetes that need to communicate with each other. Occasionally, a bug appears when accessing a specific API endpoint, but it can't be replicated in your local environment. Wouldn’t it be great if you could connect to the application processes running remotely, set breakpoints, and debug in real time? Well, you can!
In this guide, we’ll set up a system for remote debugging Python applications in Kubernetes, enabling you to step through your code and troubleshoot issues without modifying your codebase or deployment configurations.
Defining Our Objectives
Before we dive into debugging, let’s clarify our goals:
- Avoid any changes to the application code.
- Maintain the integrity of application security.
- Ensure we are debugging the actual remote code, with no traffic rerouting to local environments.
- Set breakpoints and step through code effectively.
- Debug multiple containers or Pods simultaneously, as microservices often interact.
- Create a straightforward and efficient setup.
Note: This tutorial takes inspiration from a KubeCon presentation titled “Breakpoints in Your Pod: Interactively Debugging Kubernetes Applications,” originally focused on Go applications, yet applicable to our Python context.
Setting Up the Environment
To begin debugging, we need to create and deploy a couple of applications. We will utilize a Minikube cluster for this tutorial:
minikube start --kubernetes-version=v1.26.3
We will deploy two Python applications to demonstrate debugging across multiple containers. You can find the sample application code in the provided repository, structured as follows:
project-root/
├── app1/
│ ├── __init__.py
│ ├── Dockerfile
│ ├── main.py
│ └── requirements.txt
└── app2/
├── __init__.py
├── Dockerfile
├── main.py
└── requirements.txt
Our focus will primarily be on the main.py files. For the first application, the code is as follows:
# app1/main.py
from fastapi import FastAPI
import os
import requests
app = FastAPI()
API = os.environ.get("API", "")
@app.get("/")
def sample_endpoint():
r = requests.get(f"{API}/api/test")
return {"data": r.json()}
This is a simple FastAPI application with a single endpoint that makes a request to the second application. Here is the code for the second application:
# app2/main.py
from fastapi import FastAPI
app = FastAPI()
@app.get("/api/test")
def test_api():
return {"key": "some data"}
This application merely returns a JSON response from the /api/test endpoint, called by the first application. This setup allows us to trigger breakpoints in both applications with just one request to the first app.
Building the Applications
To build these applications, we need to create Dockerfiles. Here’s the Dockerfile for the first application:
FROM python:3.11.4-slim-buster
WORKDIR /code
COPY ./requirements.txt /code/requirements.txt
RUN pip install --no-cache-dir --upgrade -r /code/requirements.txt
RUN pip install debugpy
COPY ./main.py ./__init__.py /code/app/
CMD ["uvicorn", "app.main:app", "--host", "0.0.0.0", "--port", "5000"]
This basic setup for FastAPI images includes the installation of debugpy, which is necessary for debugging. If you want to integrate this debugging approach into your existing applications, this is the only change needed.
Next, we will build and deploy the applications with the following commands:
docker build -f app1/Dockerfile -t docker.io/martinheinz/python-debugging-app1:v1.0 app1
docker build -f app2/Dockerfile -t docker.io/martinheinz/python-debugging-app2:v1.0 app2
minikube image load docker.io/martinheinz/python-debugging-app1:v1.0
minikube image load docker.io/martinheinz/python-debugging-app2:v1.0
For deployment, we’ll apply the configurations defined in deployment.yaml (available in the repository), which sets up the necessary Deployment and Service objects for each application.
We can verify that the applications are functioning correctly by executing:
kubectl port-forward svc/app1 5000
curl localhost:5000/
# {"data":{"key":"some data"}}
This command forwards the application port to the local environment, allowing us to query it and receive the expected response from the second application.
Deploying the Debugger
Now that the applications are running, we can proceed to deploy the debugger. To maintain our goal of not altering the applications, we will use Kubernetes' ephemeral containers, which are temporary containers designed for troubleshooting.
For our debugging container, we will utilize the following Dockerfile:
# debugger.Dockerfile
FROM python:3.11.4-slim-buster
RUN apt-get update && apt install -y gdb
RUN pip install debugpy
ENV DEBUGPY_LOG_DIR=/logs
This image is built with the same base as the applications to ensure compatibility, including gdb and debugpy. We also specify the DEBUGPY_LOG_DIR environment variable for logging purposes.
To build the debugger image, run:
docker build -f debugger.Dockerfile -t docker.io/martinheinz/python-debugger:v1.0 .
minikube image load docker.io/martinheinz/python-debugger:v1.0
Next, we need to inject the ephemeral container into our application Pods:
APP1_POD=$(kubectl get -l=app=app1 pod --output=jsonpath='{.items[0].metadata.name}')
APP2_POD=$(kubectl get -l=app=app2 pod --output=jsonpath='{.items[0].metadata.name}')
./create-debug-container.sh default "$APP1_POD" app1
./create-debug-container.sh default "$APP2_POD" app2
The script injects a container into the Pods with the necessary specifications, including elevated privileges and the ability to attach to the application process.
After the injection, we execute the debugger with:
kubectl exec "$APP1_POD" --container=debugger -- python -m debugpy --listen 0.0.0.0:5678 --pid 1
This command starts the debugger on port 5678 and attaches it to the primary application process.
To access both the debugger and application endpoints, we initiate port forwarding:
kubectl port-forward "$APP1_POD" 5000 5678
kubectl port-forward "$APP2_POD" 5679:5678
With this setup, the first application’s port is forwarded alongside the debugger’s, while the second application only forwards the debugger port.
Connecting to the Debugger
With the debugger waiting for connections, we can now connect through our IDE. For VS Code, configure the following in your .vscode/launch.json file:
{
"version": "0.2.0",
"configurations": [
{
"name": "Python: Remote Attach App 1",
"type": "python",
"request": "attach",
"connect": {
"host": "127.0.0.1",
"port": 5678
},
"pathMappings": [
{
"localRoot": "${workspaceFolder}/app1",
"remoteRoot": "/code/app/"
}
],
"justMyCode": true
},
{
"name": "Python: Remote Attach App 2",
"type": "python",
"request": "attach",
"connect": {
"host": "127.0.0.1",
"port": 5679
},
"pathMappings": [
{
"localRoot": "${workspaceFolder}/app2",
"remoteRoot": "/code/app/"
}
],
"justMyCode": true
}
]
}
The critical elements here are the connect.port values, which correspond to the forwarded ports, and the pathMappings that link local and remote directories.
Now, initiate the debugging sessions in VS Code by selecting “Run and Debug”:
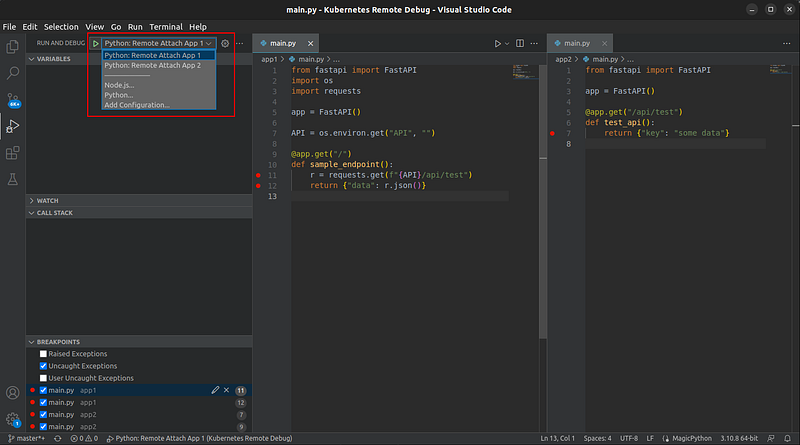
You can set breakpoints in the code and activate them by executing:
curl localhost:5000
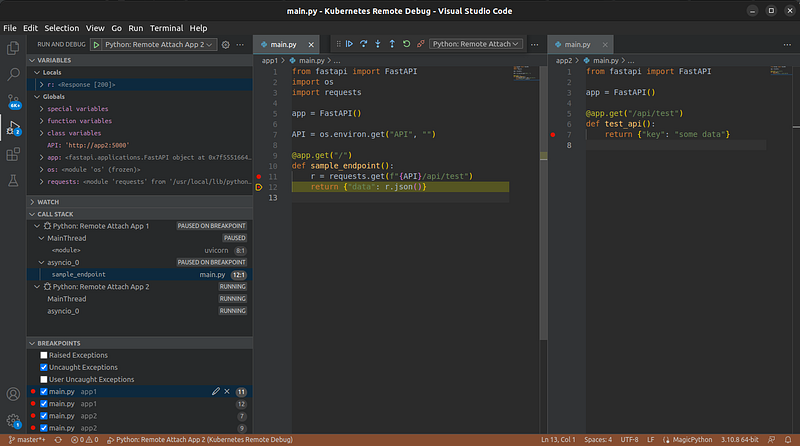
Success! You’ve hit a breakpoint in remote code and can debug it locally. If you step through the code, you’ll also be able to hit breakpoints in the second application.
Note: If you encounter issues with requests hanging (such as in Flask apps), this may be due to the debugger blocking the application process. Switching to a different web server may resolve this.
Final Thoughts
While the setup may seem complex at first glance, it mostly involves running the script to inject the ephemeral container and forwarding the debugger ports, which only takes a few moments.
Once established, you’ll gain robust remote debugging capabilities without altering your application code or needing to redeploy. This approach also facilitates debugging multiple containers or applications concurrently.
Although this guide primarily covers debugging in VS Code, it’s also compatible with PyCharm, provided you have the “Professional” edition, as it uses pydevd, the underlying library for debugpy.
Want to Connect?
This article originally appeared on martinheinz.dev.